Discussion
In this chapter we will discuss about some of the results we have reached. We will compare the render time, achieved with the methods explained in the chapter 4, with a renderer commonly used by the Computer Graphics research community: the Mitsuba renderer by . Moreover, we will discuss some correlation between the scenes and the best performing method.
Results
In table 6.1 we can see the first comparison of the Mitsuba renderer with the scenes presented in figure 4.6. There are multiple algorithms that can be used inside the Mitsuba renderer to render the scene, however the algorithm that works best in this type of scene is the simple volumetric path tracing (called volpath_simple). Contrary to our methods, this algorithm is also using shadow rays. For this reason, the total number of rays traced for this algorithm is calculated by adding the shadow rays and the normal rays traced. The results show that the number of rays traced every second by the Mitsuba volumetric path tracer is much lower than any other algorithm. In the scenes used in this comparison the density is constant and the algorithm that is performing better is the regenerationSK using the single thread regeneration. The reason being that if the density is constant, also the standard deviation over the length of a path that traverses the medium will be small. Thus, the rays are starting and stopping by themselves all together and there is no need for extra care on synchronizing the threads or compacting them. The other conclusion that is possible to take is that the GPU is performing much better than the CPU algorithm also considering the naive single kernel approach.
| method | rays/sec | |
| cgg-logo | ad | |
| naiveSK | 3.88 | 2.13 |
| regenerationSK (thread) | 81.62 | 42.37 |
| regenerationSK (warp) | 4.37 | 7.02 |
| streamingSK (compaction) | 52.69 | 37.81 |
| streamingSK (sorting) | 20.41 | 17.61 |
| sortingSK | 20.90 | 17.83 |
| mitsuba (volpath_simple) | 0.003 | 17.83 |
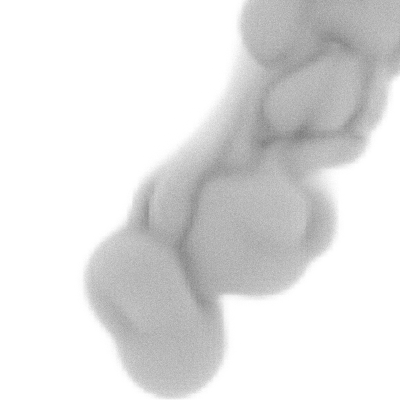
Let’s consider now a scene with varying density but not varying albedo, like the one in figure 6.1. The results relative to this scene are presented in the table 6.2. The table shows the millions of rays per second and the total time to render the smoke scene with density scale factor 800 which corresponds to the scaling factor of the 0 to 1 density volume. The results are showing that in this case the algorithm that is performing better is the streamingSK. The explanation can be found in the long duration of some rays inside the medium compared to other rays that are ending immediately. In this case, the streaming method is able to group together the long term rays and decrease the divergence of the warps. This results in a better efficiency of the streaming algorithm when the scenes present high varying density. However, the complexity of the density function is not the only factor to take in consideration.
| method | rays/sec | time (sec) |
|---|---|---|
| regenerationSK (thread) | 2.52 | 131 |
| regenerationSK (warp) | 7.35 | 127 |
| streamingSK (compaction) | 17.41 | 53.68 |
| sortingSK | 14.64 | 63.83 |
| mitsuba (volpath_simple) | 0.58 | 1076 |
| mitsuba (volpath) | 0.54 | 1195 |
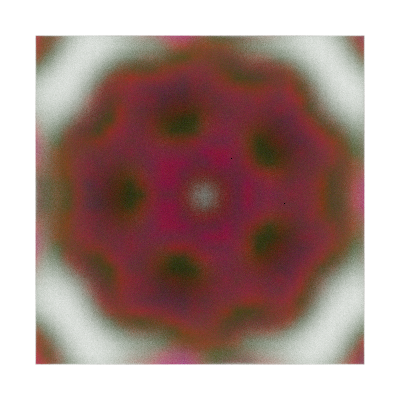
The scene in figure 6.2 presents an high varying density but a small texture resolution. In this case the methods that are using compaction are performing worse than the RegenerationSk method with a single thread regeneration as it is showed in the table 6.3. A possible reason for this behavior can be attributed to the ratio between traced paths and grid resolution. That is, in this type of scenes if the number of rays is high enough it is more probable that groups of rays access the same texture data. That happen because the texture resolution is much lower respect to the previous cases. If threads that are close together access the same texture values they are behaving similarly to the case of constant density factor and exactly like in that case a simple method, like the regenerationSK, that fully utilize the GPU gives the best performance gain.
| method | rays/sec | time (sec) |
|---|---|---|
| regenerationSK (thread) | 10.96 | 39.71 |
| streamingSK (compaction) | 5.75 | 52.83 |
| sortingSK | 5.69 | 53.30 |
| naiveSK | 4.99 | 60.86 |
Which is the Best?
Looking at the results that we have showed, we can say that the best algorithm to use for GPU volumetric path tracing closely depends on the type of scene we want to render. We have seen that for complex scenes with high varying density and high resolution texture the more sophisticated algorithm which uses compaction and smart regeneration are performing better. On the other hand, if our scene is a simple scene, simple methods which requires less synchronization between threads and less branch divergence are getting better results.