Convergence across scenes
4648adc · 2026-07-26 ↗
The final part of commit 4648adc compares four complete rendering pipelines:
the CPU path tracer, CPU ReSTIR, GPU path tracer, and GPU ReSTIR. The
comparison is repeated across scenes because an integrator does not have one
scene-independent convergence rate. Light count, indirect illumination,
visibility, material support, and GPU utilization all change the result.
This chapter records the protocol, commands, metrics, reference images, and graphs together. Hardware and software provenance is attached directly to each graph, so results from other platforms can be added without changing the experiment’s platform-independent description. The discussion also separates conclusions supported by the data from questions that require another experiment.
Experimental scope
The committed curves share the following protocol:
| Parameter | Recorded configuration |
|---|---|
| Renderer revision | 4648adc |
| Build capabilities | GPU_ENABLED=ON, METRICS_ENABLED=ON |
The stored result JSON contains scene and renderer fingerprints, pipeline, seeds, sample limits, metric, resolution level, and timestamps. It does not store the host hardware or operating-system version. That provenance is therefore stated in every graph caption rather than inferred from the result files. A future version of the benchmark should write these fields into every result.
Each curve uses:
- sample counts doubling from 8 up to 8192;
- one timing run per point;
- a 60-second limit for one rendered image;
resolutionLevel=1;- split screen disabled and the firefly filter enabled;
- benchmark seed 0;
- reference seed 104729 when an independent reference is available.
Most captures are 960 × 700 pixels. The Cornell-box and area-light captures are 960 × 640 because their source stages use a different framing.
One run is not sufficient to estimate timing variance or construct a confidence interval. Differences between nearby curves must therefore be treated as observations from this run, not as stable performance rankings. The horizontal coordinate includes the complete capture command measured by the test process; it is not an isolated GPU-kernel duration.
Commands that generated the data
The ordinary noise curves for all repository scenes were generated with:
just perf-compare-all-scenes "" 0.01 8 8192 60 1
Independent 2048-spp path-tracer references were captured with seed 104729.
Set USD_ASSETS_ROOT to the local directory containing the optional OpenUSD
assets:
export USD_ASSETS_ROOT=/path/to/openusd-assets

just capture-comparison-references \
  "$USD_ASSETS_ROOT" \
  "full_assets/CarbonFrameBike/CarbonFrameBike\.usdz" \
  "full_assets/OpenChessSet/chess_set\.usda"
The reference-RMSE graphs were then produced with:
just perf-compare-reference-scenes \
  "$USD_ASSETS_ROOT" \
  "full_assets/CarbonFrameBike/CarbonFrameBike\.usdz" \
  "full_assets/OpenChessSet/chess_set\.usda"
The recipes expand to tests/perf_test.py with the four pipeline names, a
target of 0.01, sample bounds 8–8192, a 60-second per-image budget, benchmark
seed 0, and reference seed 104729. Compatible completed observations are
reused; an interrupted curve resumes after its last stored sample count.
Graphs can be redrawn without rendering through
just perf-redraw-all-scenes and just perf-redraw-reference-scenes.
The following excerpt was added by the commit and is the source of the reference comparison:
def _relative_rmse_to_reference(image_path, reference_path):
    image = _read_hdr_pixels(image_path).astype(np.float64)
    reference = _read_hdr_pixels(reference_path).astype(np.float64)
    reference_rms = float(np.sqrt(np.mean(reference * reference)))
    return float(
        np.sqrt(np.mean((image - reference) ** 2))
        / max(reference_rms, 1e-12)
    )
The complete implementation also checks that both HDR images have identical dimensions before subtracting them.
What the two vertical axes mean
The graphs use two different quantities. They answer different questions and must not be combined into one ranking.
Internal noise estimate
For pixel (p), let (X_{p,1},\ldots,X_{p,n}) be its luminance samples, (\bar X_p) their mean, and
\[s_p^2 = \frac{1}{n-1} \sum_{i=1}^{n}(X_{p,i}-\bar X_p)^2\]their unbiased sample variance when the samples are independent and identically distributed. The renderer estimates the variance of the mean as (s_p^2/n), averages this quantity over the (P) pixels, and reports
\[N_{\mathrm{rel}} = \frac{ \sqrt{\frac{1}{P}\sum_{p=1}^{P}\frac{s_p^2}{n}} }{ \frac{1}{P}\sum_{p=1}^{P}\bar X_p }.\]This is a scale-relative estimate of stochastic fluctuation. It does not compare the image with the correct solution. The CPU accumulation pass stores the luminance sums in double precision. The GPU pass stores them in float because the backend used for this dataset does not expose shader double precision, then reduces 256 pixels per threadgroup before readback.
Temporal reuse makes consecutive estimates correlated. For correlated random variables,
\[\operatorname{Var}[\bar X] = \frac{1}{n^2} \left( \sum_i \operatorname{Var}[X_i] +2\sum_{i<j}\operatorname{Cov}[X_i,X_j] \right).\]The (s^2/n) diagnostic omits the covariance terms. The derivation and its limitations are discussed in Renderer performance metrics.
Error against an independent HDR reference
Let (I) be a measured render and (R) a 2048-spp reference, with (K=3WH) scalar RGB values. The reference graphs use
\[E_{\mathrm{ref}}(I,R) = \frac{ \sqrt{\frac{1}{K}\sum_{k=1}^{K}(I_k-R_k)^2} }{ \max\left( \sqrt{\frac{1}{K}\sum_{k=1}^{K}R_k^2}, 10^{-12} \right) }.\]Every pipeline uses the same denominator for a given scene. A bright outlier in a tested image therefore cannot reduce its own reported error by increasing the normalization scale.
Reference RMSE includes stochastic variance, estimator bias, systematic renderer differences, and the remaining error in the finite-sample reference. For a scalar estimator (\hat I) and exact target (I^\star),
\[\mathbb E[(\hat I-I^\star)^2] = \operatorname{Var}[\hat I] +\left(\mathbb E[\hat I]-I^\star\right)^2.\]This identity explains why a curve can show low internal noise while retaining higher reference error: low fluctuation alone does not prove correctness.
How to read the graphs
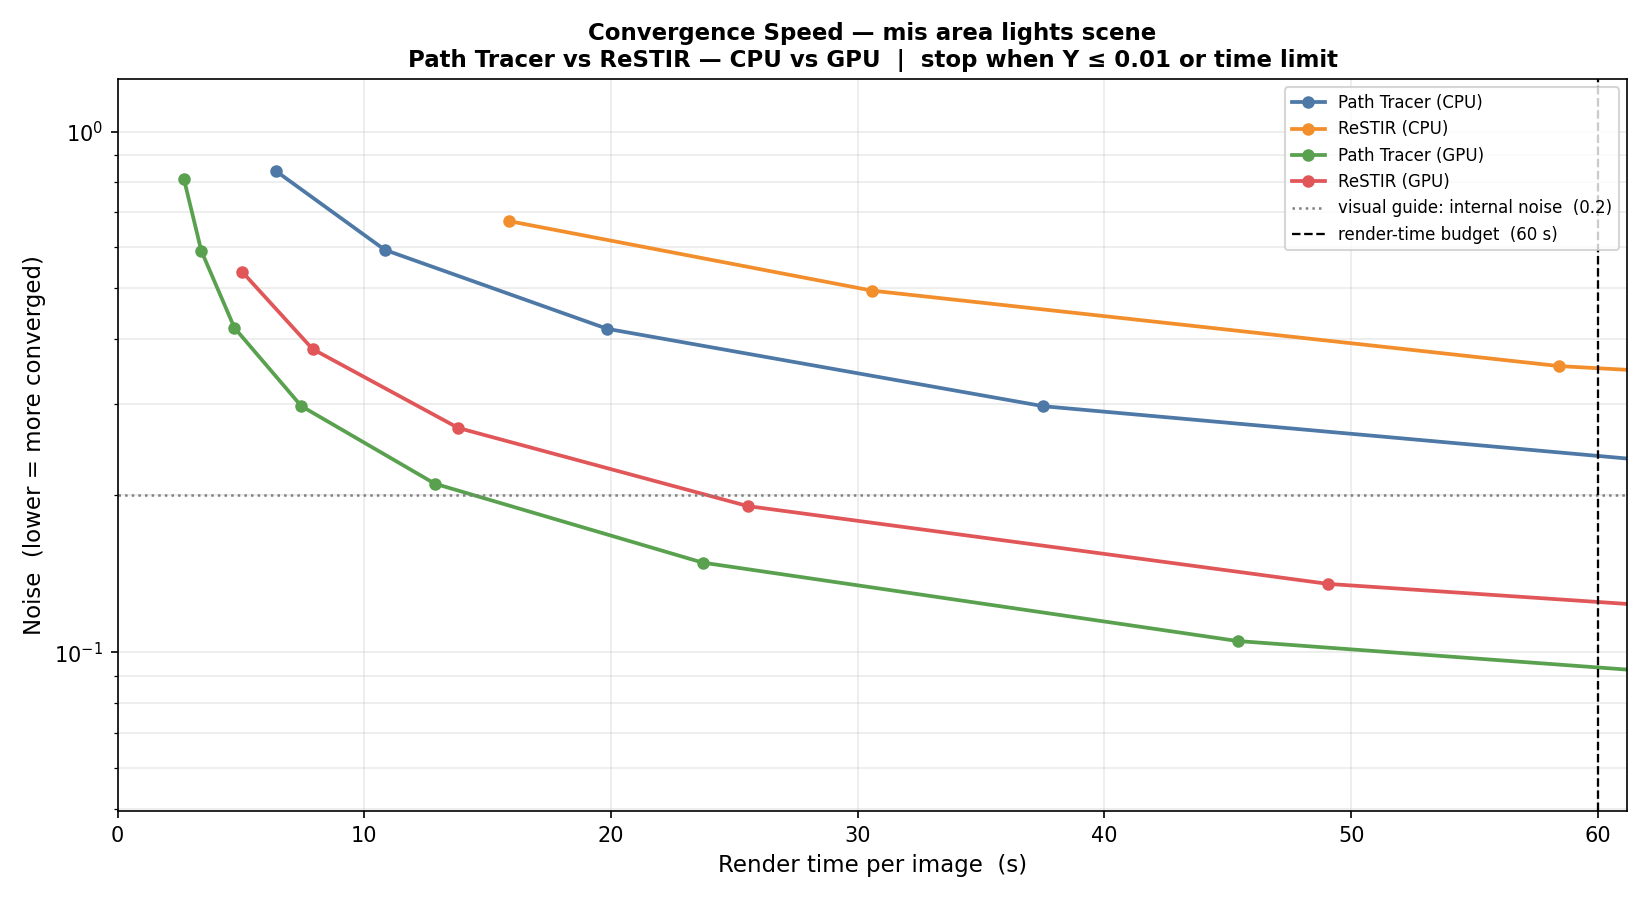
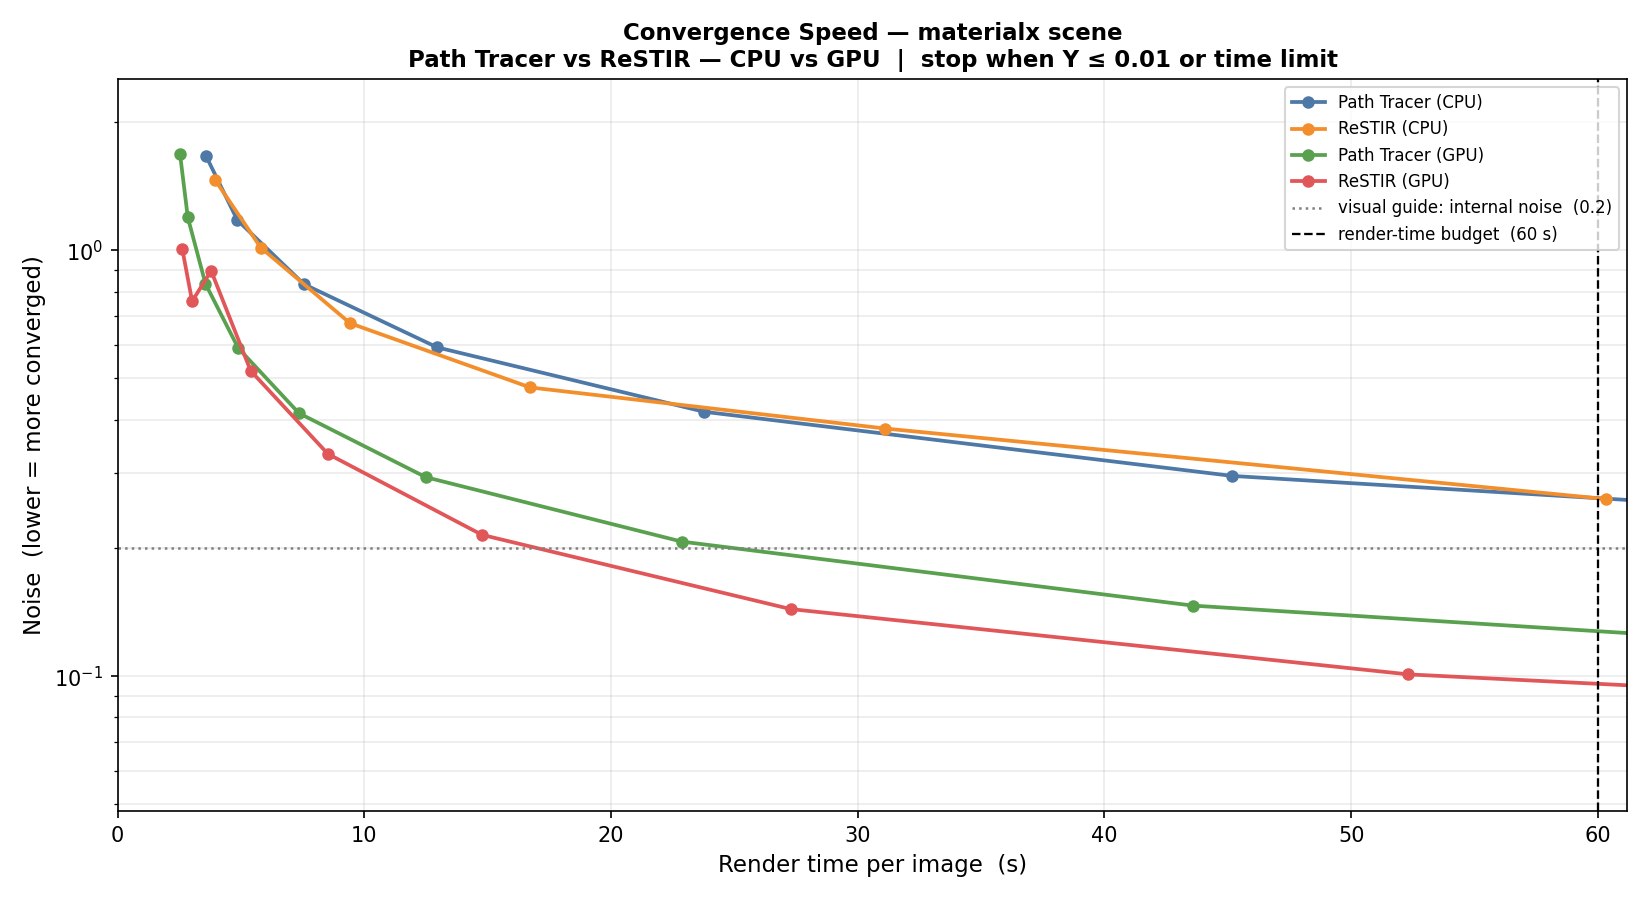
Each marker is one complete render at a particular sample count. Sample counts increase from left to right only indirectly: the horizontal coordinate is the measured time for that image, not the sample count. Each pipeline doubles its sample count independently.
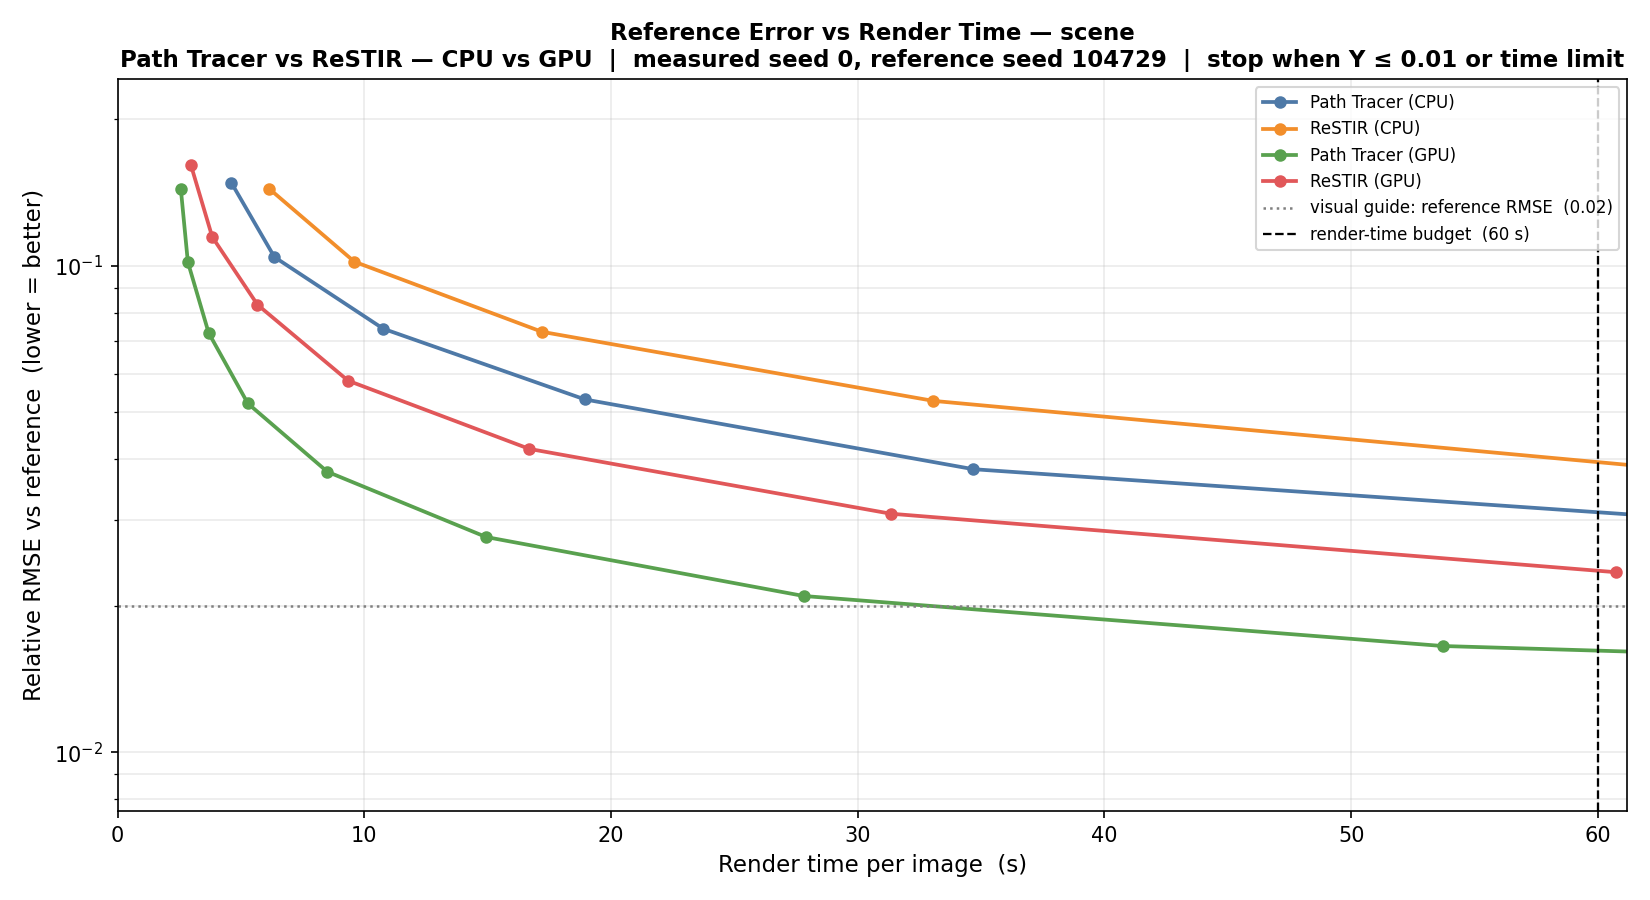
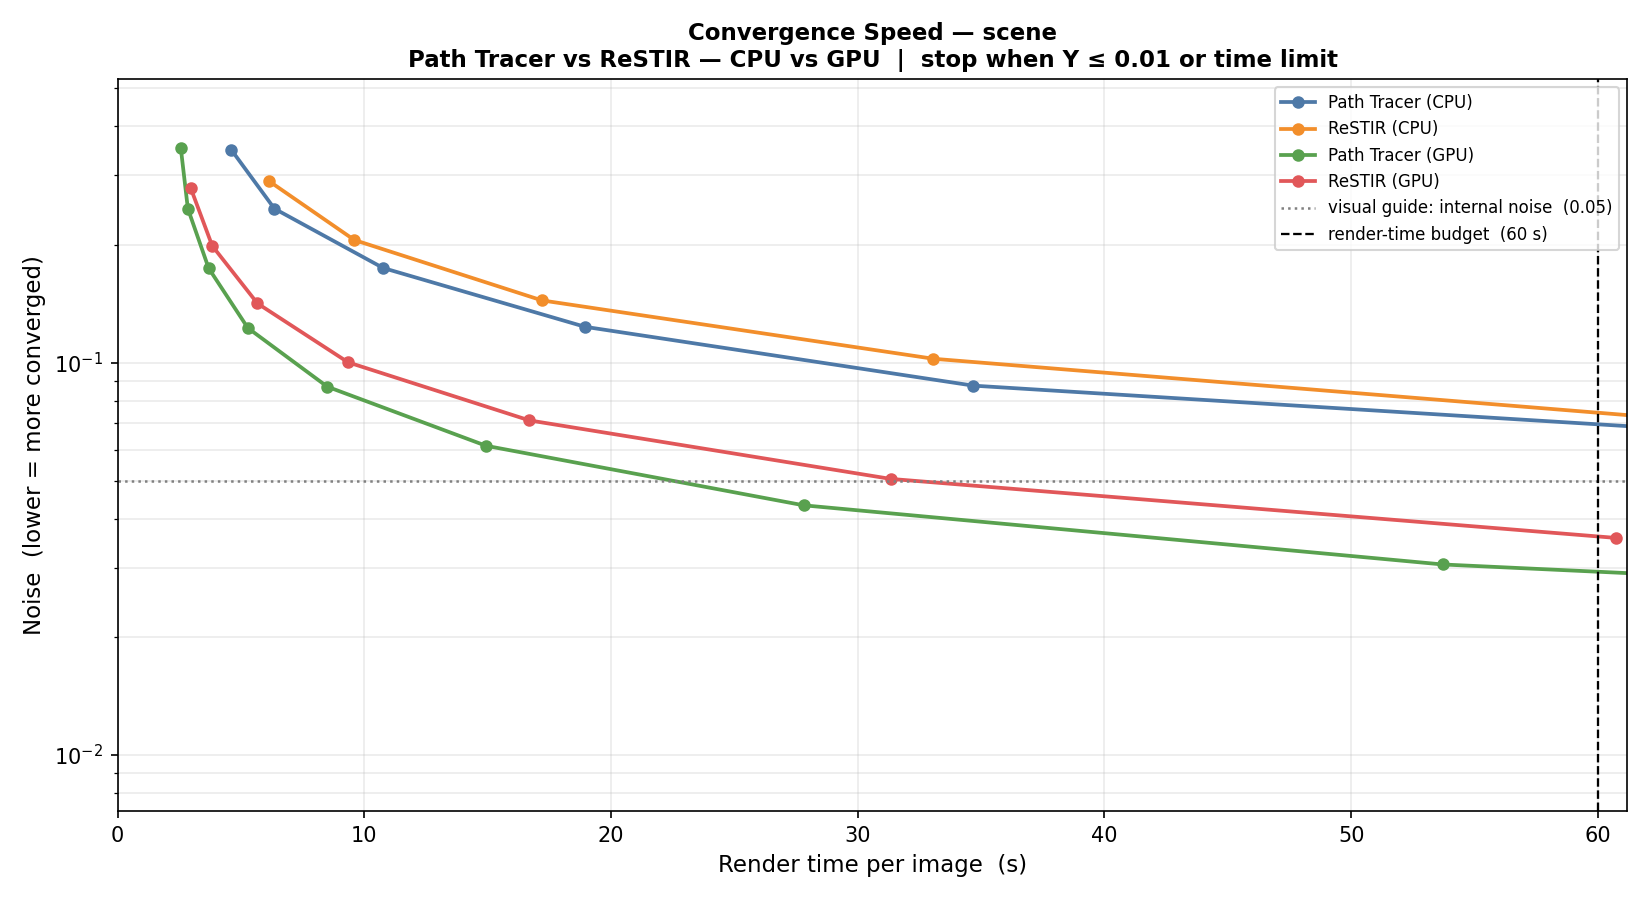
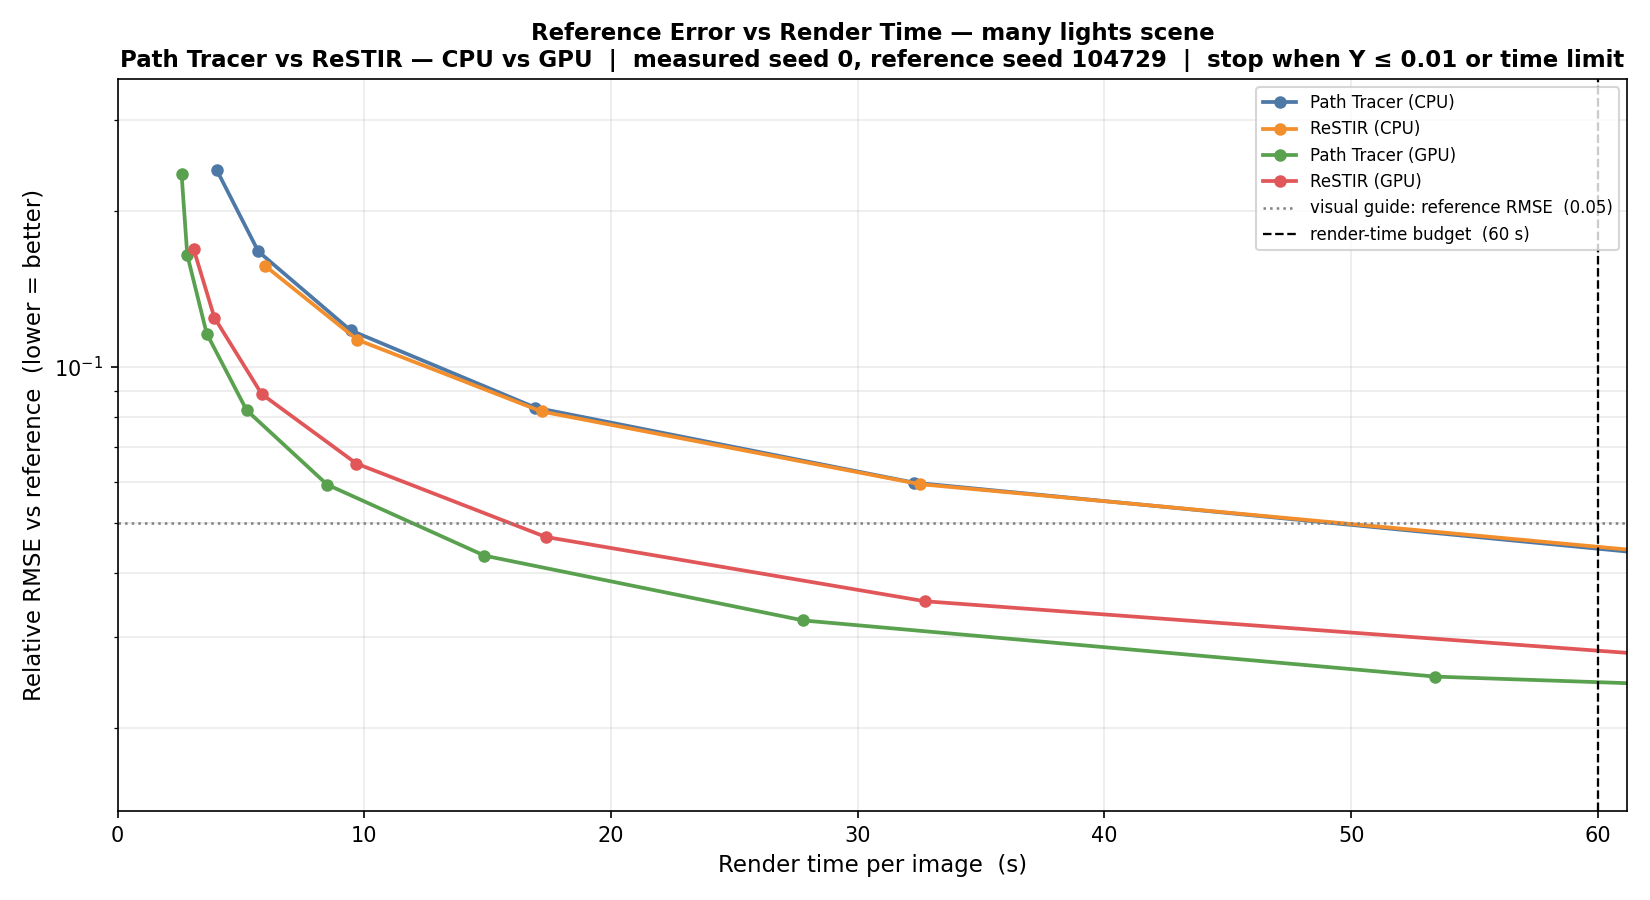
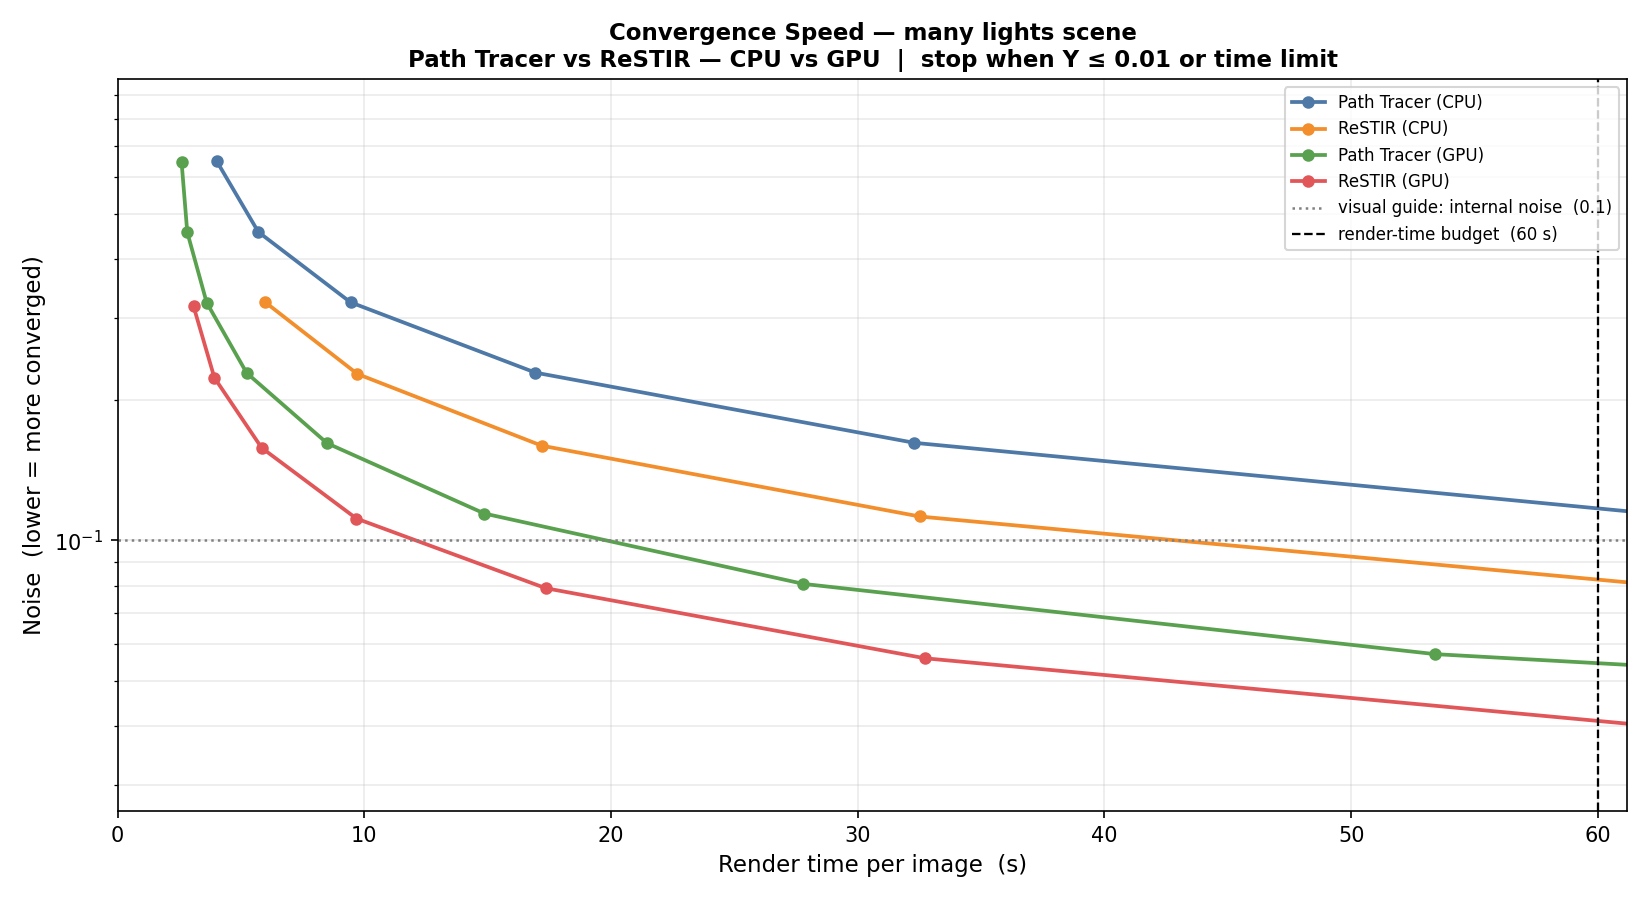
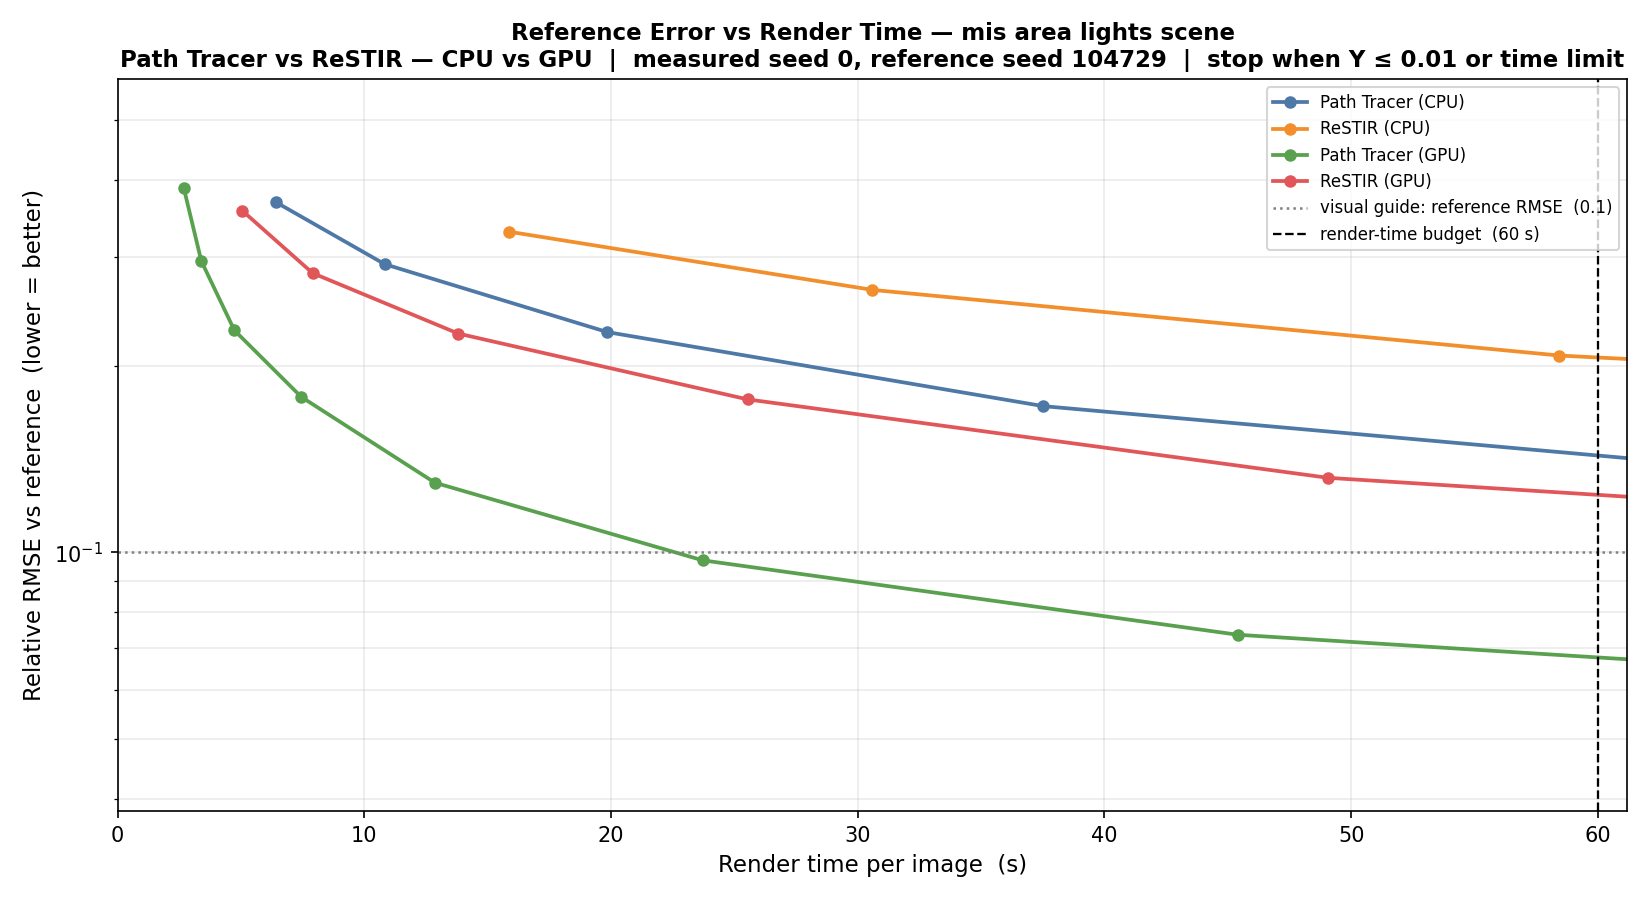
The vertical dashed line is the 60-second per-image budget. The dotted horizontal line is a readable visual guide selected from the data; it is not always the requested 0.01 stopping threshold. None of the committed curves reached 0.01 inside the 60-second budget.
For a curve that exceeds the budget, the result record retains its latest point whose individual render time is at most 60 seconds. The tables compare those retained points and report the lowest value among the four pipelines. They are summaries of this run, and their points need not occur at exactly the same time.
| Scene with reference | Lowest latest-in-budget reference RMSE | Pipeline | Time of that point |
|---|---|---|---|
| Internal scene | 0.01653 | GPU Path Tracer | 53.705 s |
| Many lights | 0.02520 | GPU Path Tracer | 53.407 s |
| MIS area lights | 0.07358 | GPU Path Tracer | 45.396 s |
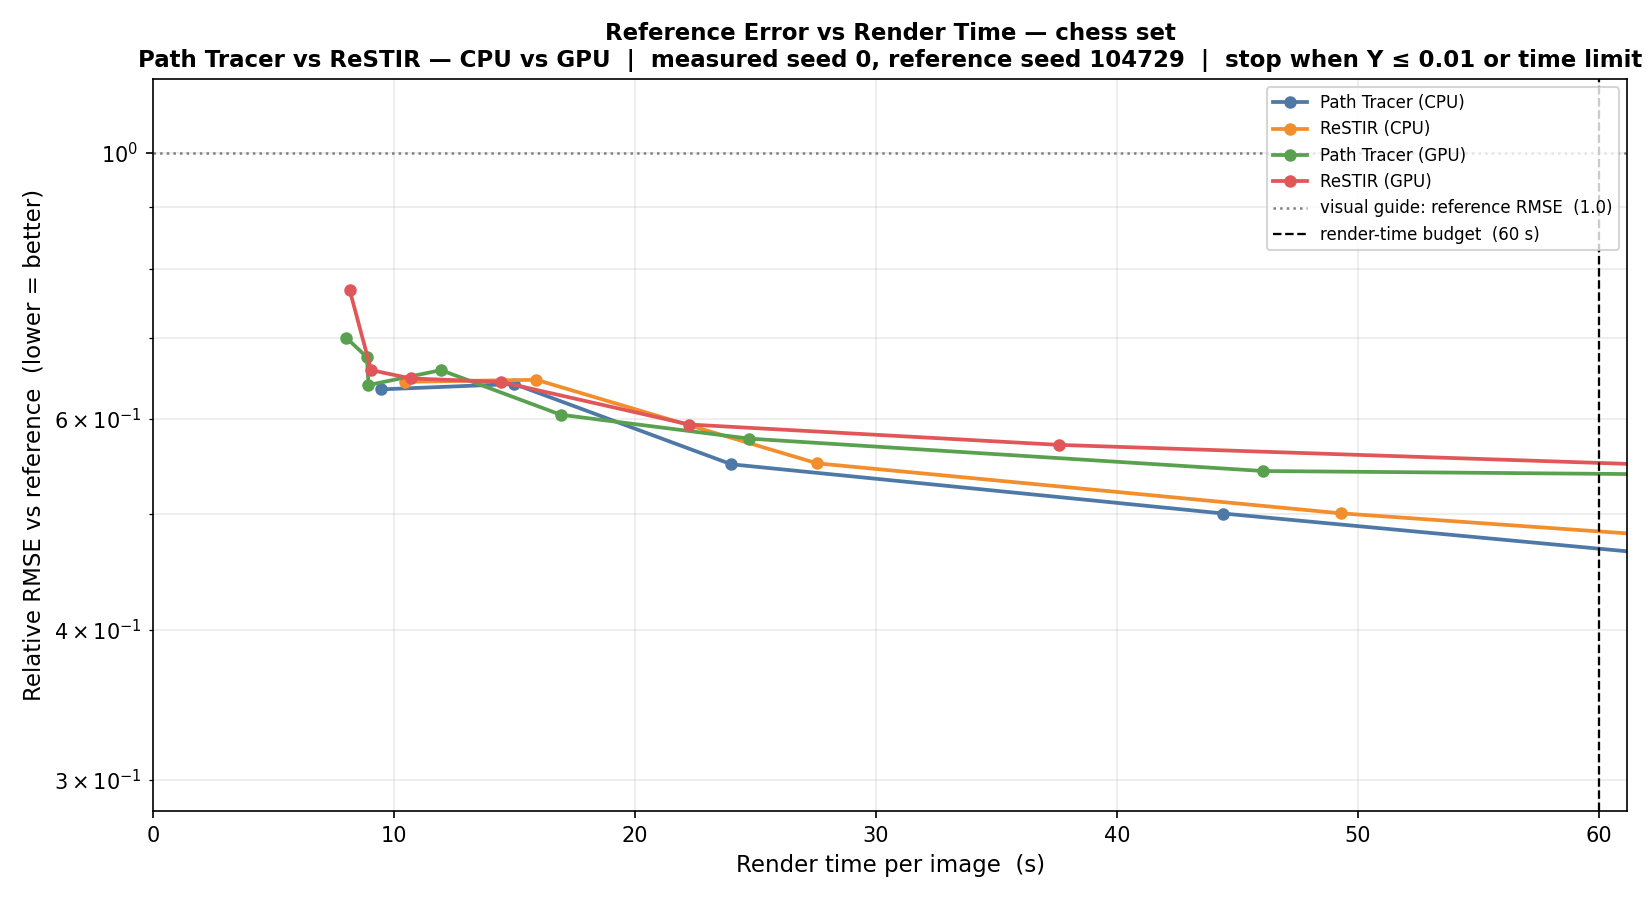
| Carbon Frame Bike | 0.56355 | GPU ReSTIR | 47.566 s |
| Open Chess Set | 0.50006 | CPU Path Tracer | 44.430 s |
| Scene with internal-noise graph | Lowest latest-in-budget relative noise | Pipeline | Time of that point |
|---|---|---|---|
| Internal scene | 0.03061 | GPU Path Tracer | 53.705 s |
| Many lights | 0.05594 | GPU ReSTIR | 32.725 s |
| MaterialX | 0.10094 | GPU ReSTIR | 52.319 s |
| MIS area lights | 0.10506 | GPU Path Tracer | 45.396 s |
| Cornell-box GI | 0.06639 | GPU Path Tracer | 40.057 s |
The many-lights noise values for GPU ReSTIR and the GPU path tracer differ by about two percent. With one timing run and no uncertainty estimate, that small gap is not evidence of a reproducible winner.
Internal scene
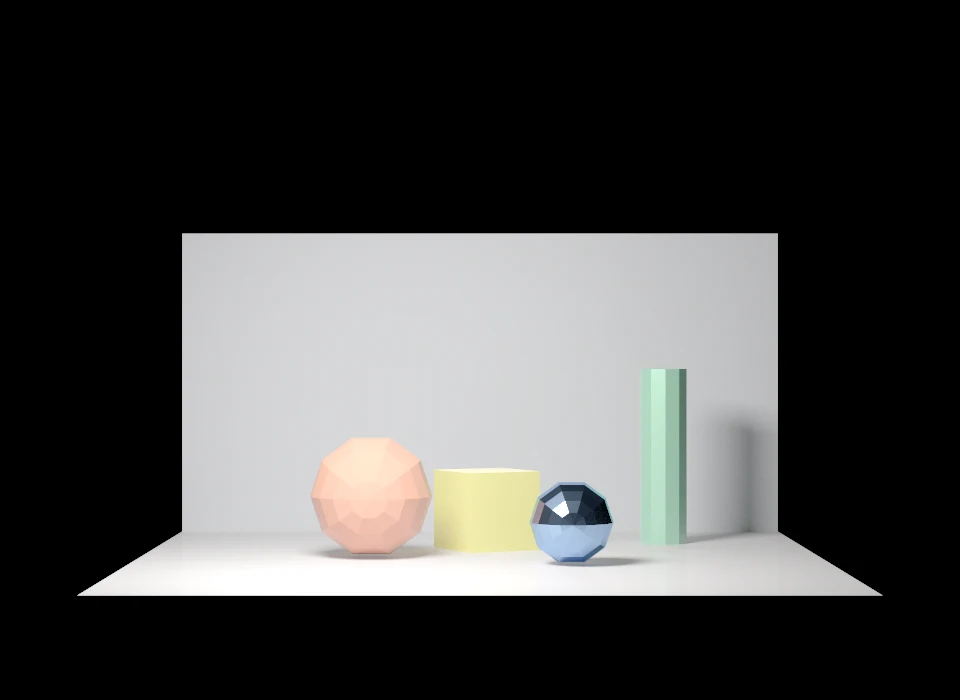
The internal scene combines diffuse and glossy objects, direct illumination, shadows, and a small set of simple materials.
4648adc;
one timing run per point.
4648adc;
one timing run per point.
The GPU path tracer has the lowest curve for both metrics in this scene. GPU ReSTIR improves over both CPU curves at comparable times, but remains above the ordinary GPU path tracer. This result applies to the current one-candidate temporal implementation; it does not establish that reservoir reuse is generally slower.
Many lights
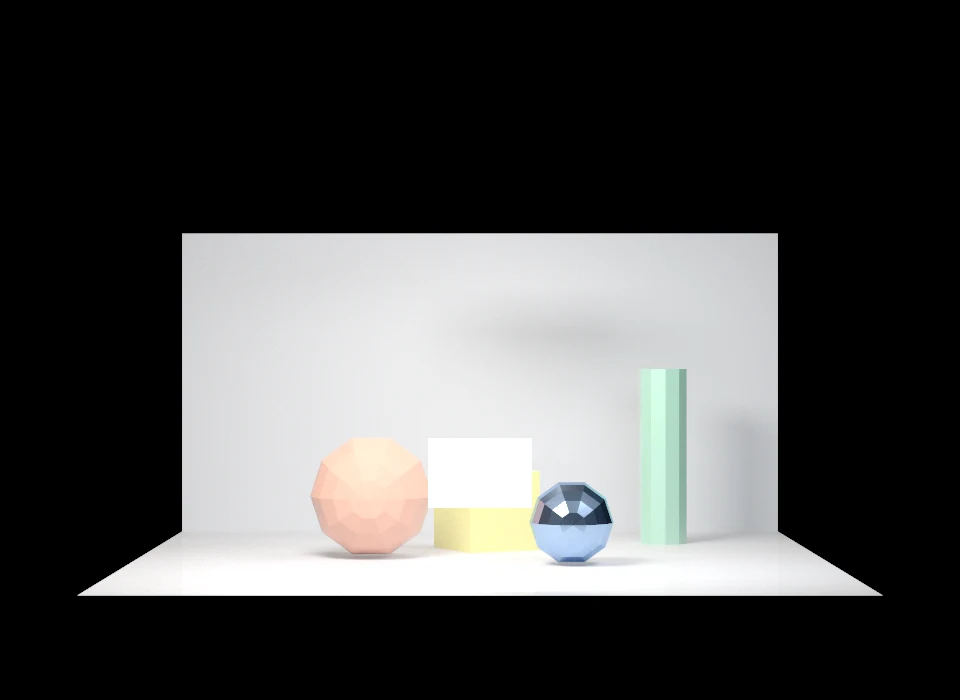
This stage makes direct-light selection more important by increasing the number of emitters.
4648adc;
one timing run per point.
4648adc;
one timing run per point.
The two metrics give a useful warning. GPU ReSTIR reports slightly lower internal noise at its latest in-budget point, while the GPU path tracer has lower error against the independent reference. Temporal correlation, a systematic difference, or both can create this pattern. The plots alone do not identify which term is responsible.
MIS area lights
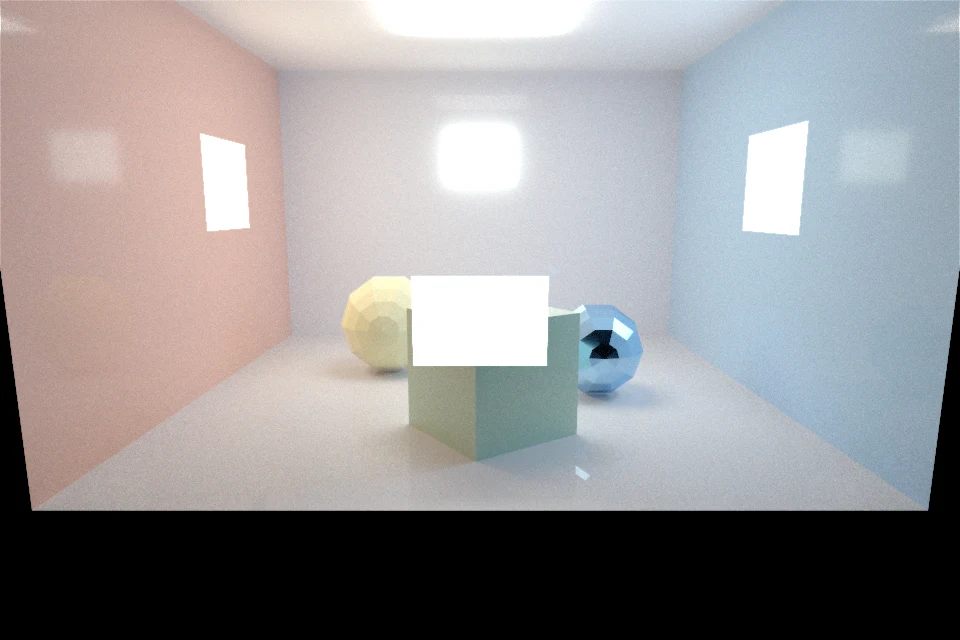
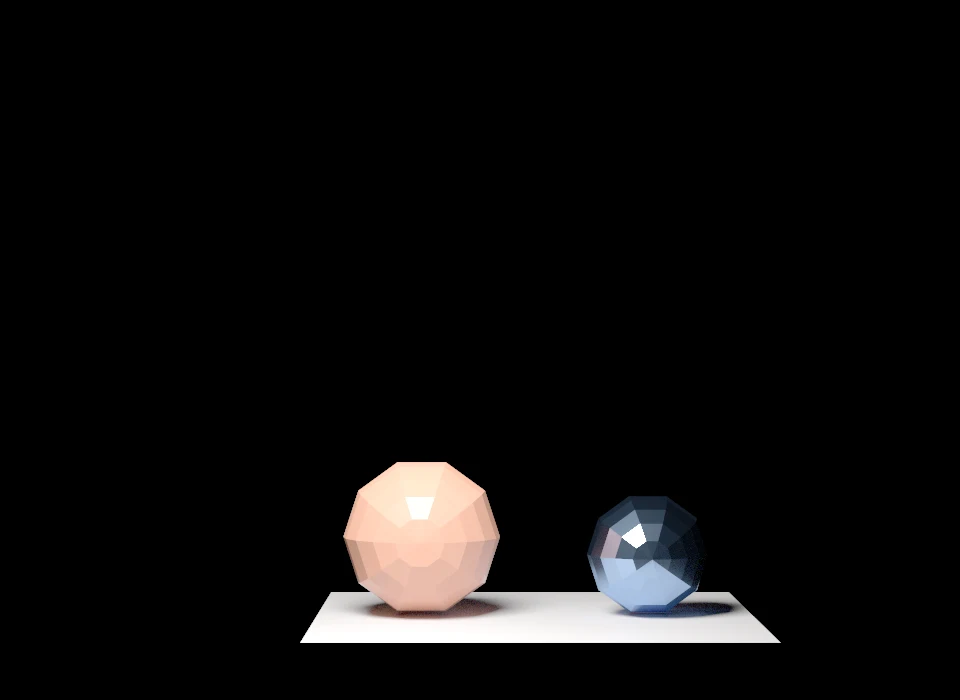
This stage contains several finite-area emitters and therefore exercises light/BSDF multiple importance sampling.
4648adc;
one timing run per point.
4648adc;
one timing run per point.
The GPU path tracer is lowest for both recorded quantities. In this configuration, the cost and correlation introduced by the temporal reservoir do not recover enough variance reduction to overtake ordinary GPU MIS within the budget.
MaterialX scene
The MaterialX stage checks that the comparison also passes through Hydra’s material-network translation rather than using only built-in parameters.
4648adc;
one timing run per point.
GPU ReSTIR has the lowest recorded internal-noise value, but no reference-RMSE graph accompanies this scene in the commit. The data therefore supports a statement about the renderer’s variance diagnostic only, not about absolute image accuracy.
Cornell-box global illumination
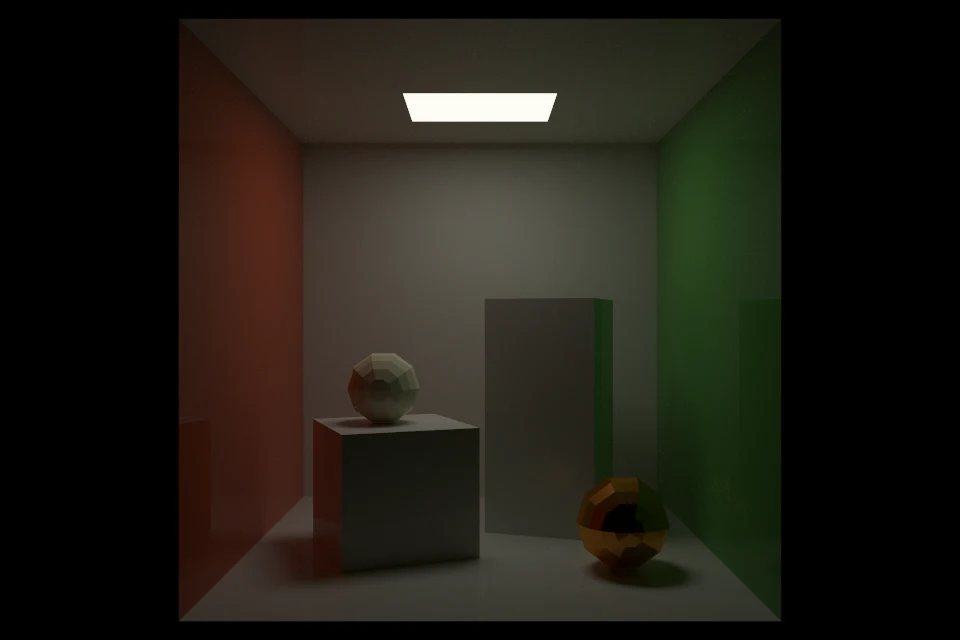
The Cornell-box stage emphasizes indirect transport. The current ReSTIR implementation resamples direct-light candidates; it does not resample entire multi-bounce paths.
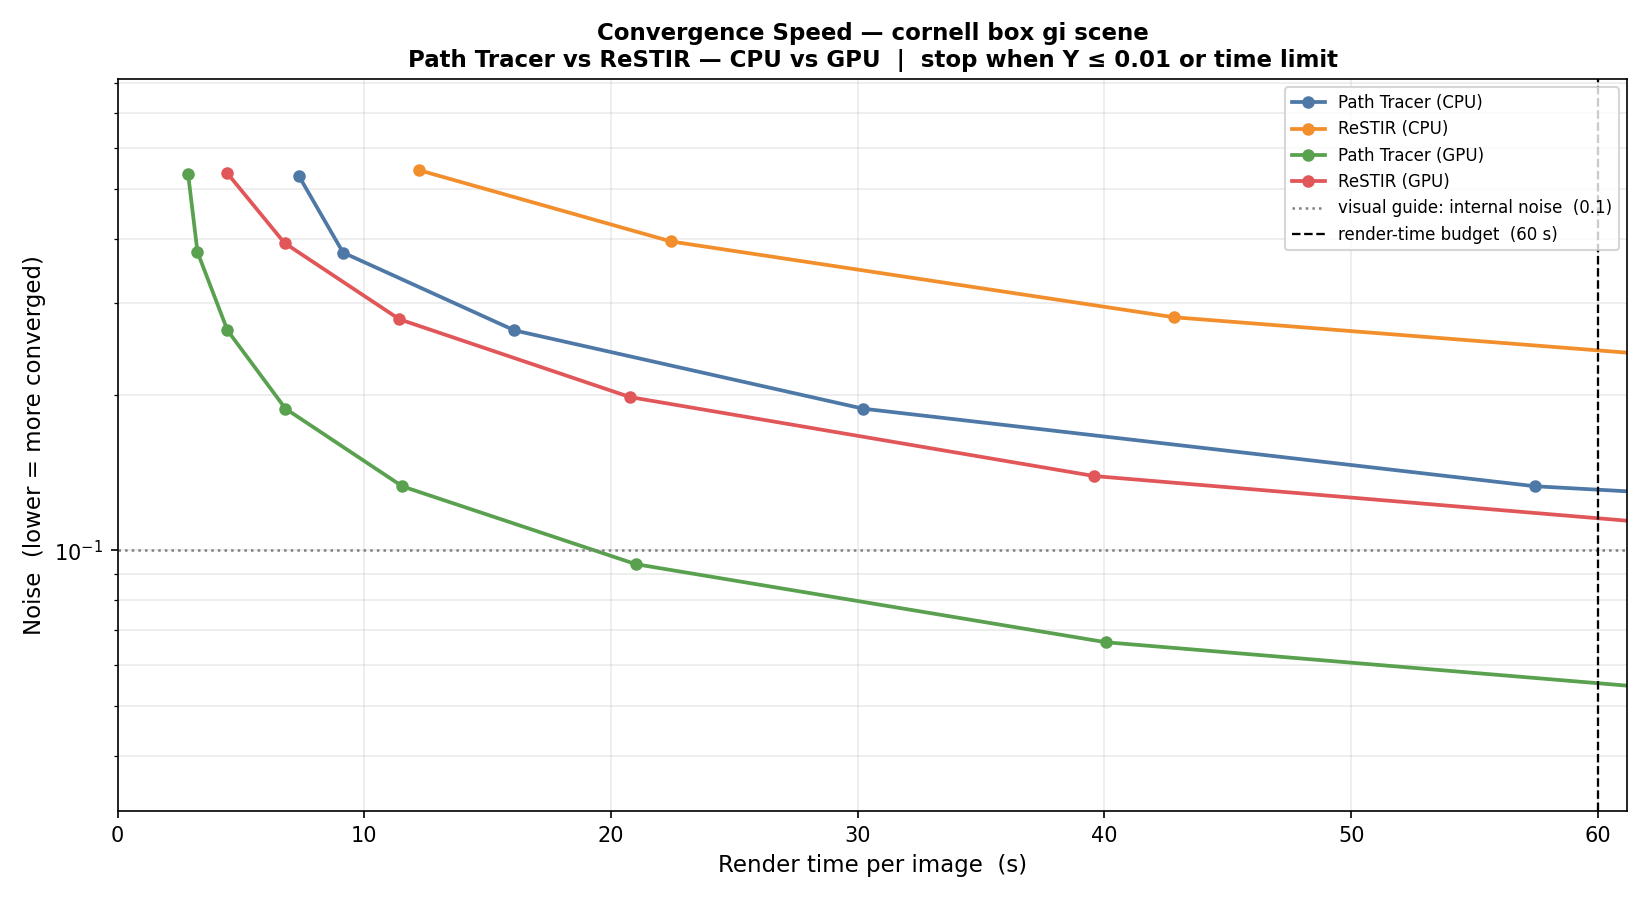
4648adc;
one timing run per point.
The ordinary GPU path tracer is lowest. CPU and GPU ReSTIR both remain above their corresponding ordinary path tracers. This is consistent with a scene whose difficult contribution is indirect transport, but the graph does not by itself prove that indirect illumination is the only cause.
External OpenUSD assets
The Carbon Frame Bike and Open Chess Set stages exercise larger scene graphs, texture and material data, and asset resolution outside the small repository examples.
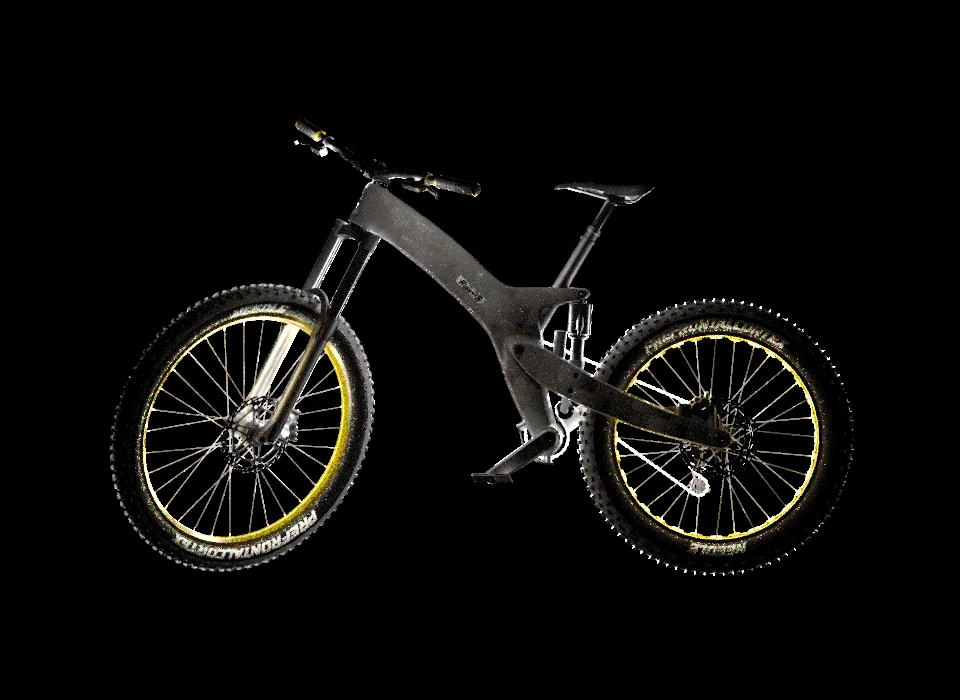
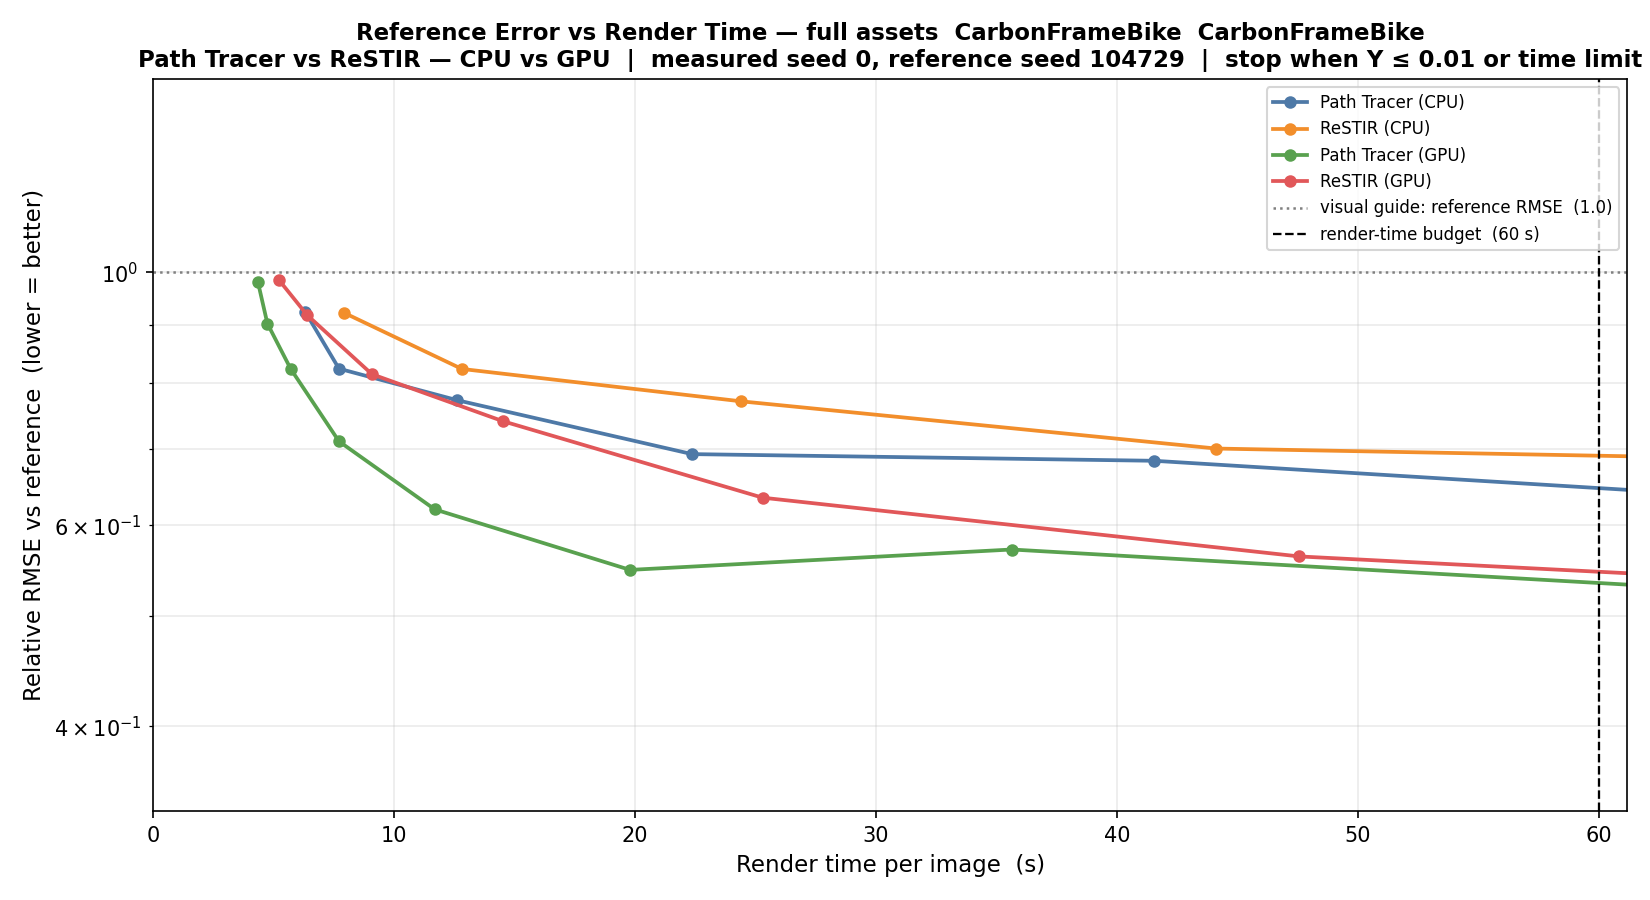
4648adc;
one timing run per point.
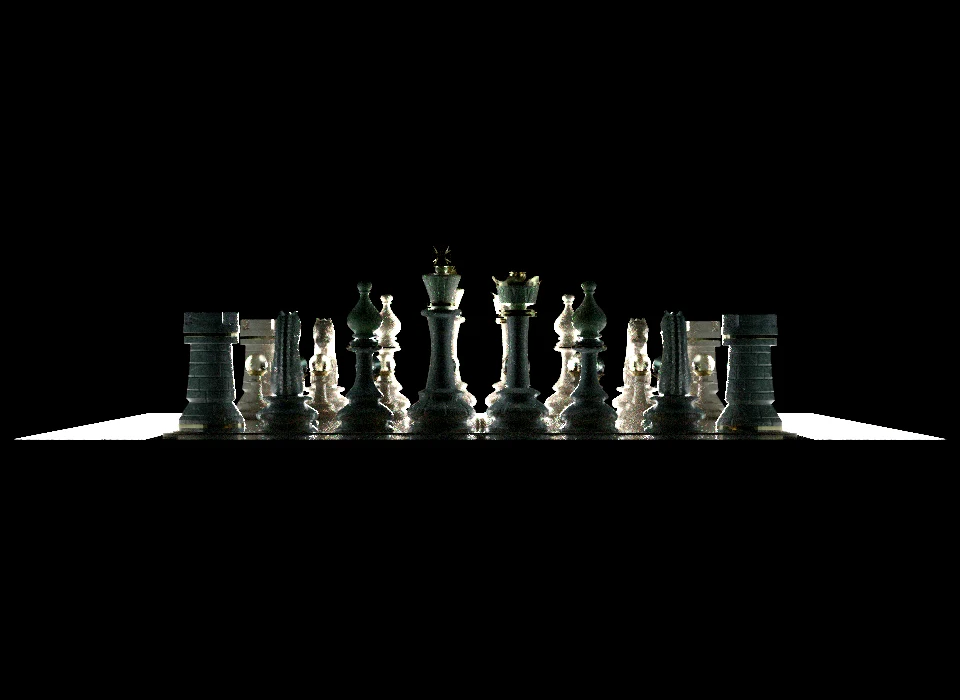
4648adc;
one timing run per point.
The external-asset curves remain near 0.5–0.7 and flatten far above the 0.01 target. Increasing samples alone is not removing most of the difference. Possible causes include deterministic pipeline differences, material or texture support, camera or asset-resolution state, and residual error in the reference. The present experiment does not distinguish these hypotheses. These plots should therefore be treated as diagnostics that motivate a parity investigation, not as evidence that one processor is a fixed percentage faster than another.
Reproducing only the figures
Completed curves are stored below build/performance_results/. Redrawing does
not execute the renderer:
just perf-redraw-all-scenes
just perf-redraw-reference-scenes \
  "$USD_ASSETS_ROOT" \
  "full_assets/CarbonFrameBike/CarbonFrameBike\.usdz" \
  "full_assets/OpenChessSet/chess_set\.usda"
The scene previews on this page are display conversions, not metric inputs. The normal conversion was:
magick input.hdr -colorspace sRGB -strip -quality 88 output.webp
The original HDR files remain the inputs to perf_test.py.
What the measurements establish
For this revision, seed policy, and 60-second budget:
- the ordinary GPU path tracer gives the lowest reference error on the three small scenes with complete reference comparisons;
- GPU ReSTIR can reduce the internal variance diagnostic without producing the lowest independent-reference error;
- direct-light reservoir reuse does not improve the Cornell-box GI result;
- the external assets expose a large error floor that needs a parity study;
- no pipeline reaches the requested 0.01 criterion inside the budget.
The next useful experiment is not another single timing run. It is a repeated measurement with hardware provenance embedded in the JSON, confidence intervals for wall time, an independent reference for every scene, and difference images separating localized material mismatches from stochastic noise.